IWS/Graph
Graph your IWS Data—and so much more!
IWS/Graph™ is the graphical interface for IWS. It fully supports all versions of IWS – IBM’s Workload Scheduler, formerly known as TWS.
All IWS users – whether mainframe, distributed or end-to-end – can enjoy the benefits that IWS/Graph has to offer:
- Create graphical flowcharts of the IWS distributed and/or z/OS environments
- Display any subnet Predecessor and Successor flows from any selected point
- Uncover “unresolved predecessors”
- Graphically see, on a time axis, when a job will run
- Search and display “redundant” dependencies
- Print or export net plans to other groups as email attachments
- View all information graphically (including calendars, special resources, operator instructions, etc.)
- Create powerful cross-reference reports, including HTML!
- Monitor your z/OS Current Plan
- Graphically maintain your IWS database
- Automatically create BatchLoader statements from net plans.
- And much, much, more…

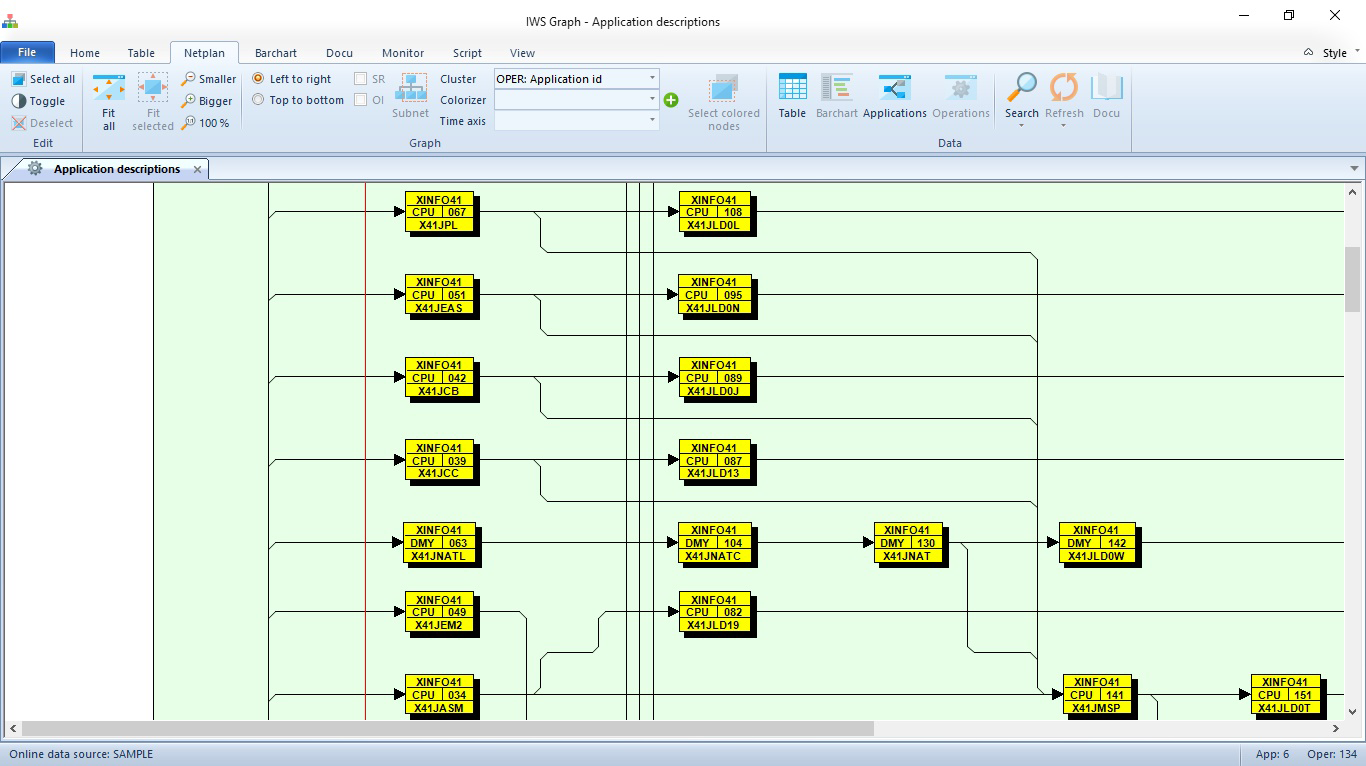
Graph showing data from the AD (Right-click to view full-size)
IWS/Graph
- Quick and easy to install and use
- 100% reliable
- 100% secure
- Excellent return on investment
- Helps improve the quality of your data
For more information on IBM’s Workload Management tools, please visit the Workload Scheduler product pages on IBM’s site.
(For distributed systems: Workload Scheduler)

Current Version: 6.3
6.2 End of Support: September 30, 2026
Resources
Technical Updates
Join this email list to receive notification when IWS/Graph technical updates, such as fixes, new versions, etc. have been released.
Information is provided on an "as needed" basis only. You will not receive emails regarding other products.
